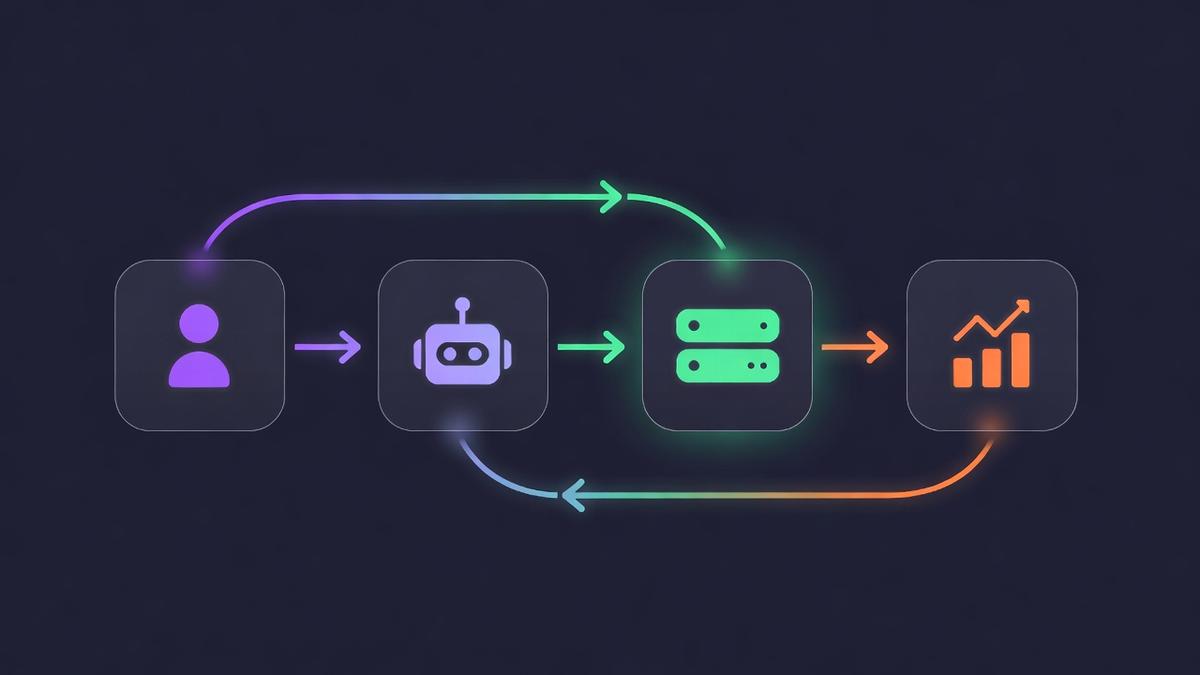
Try it with mock data — no API key required
/api/demo/revenue?resolution=weekly&start_date=2025-09-01&end_date=2026-03-15 // Click "Query Chart" to see response
User asks their AI agent a question like "What's our churn rate trend?" The agent recognizes this needs subscription data and calls the MCP tool.
query_chart({ "chart_name": "churn", "start_date": "2025-10-01", "end_date": "2026-03-15", "resolution": "monthly" })
The MCP Server authenticates with your RevenueCat API key and forwards the request to the Charts API v2, handling pagination and rate limits.
GET /v2/projects/{pid}/charts/churn Authorization: Bearer sk_xxx ?resolution=monthly &start_date=2025-10-01 &end_date=2026-03-15
The agent receives structured time-series data, performs analysis, identifies trends, and returns an actionable summary in natural language.
// Agent's analysis: 📉 Churn decreased from 5.8% to 3.2% 🎯 45% improvement over 6 months 💡 Biggest drop after paywall redesign in December (5.1% → 3.8%)
query_chart Query any chart with date ranges, resolution, segmentation, and filters. Returns time-series data for revenue, MRR, churn, subscribers, and more.
get_chart_options Discover available filters, segments, and resolutions for any chart. Enables agents to self-discover capabilities without hardcoded knowledge.
list_charts List all available chart types with names and descriptions. Agents can understand what analytics are available before querying.
// ~/.claude/mcp_servers.json { "revenuecat-charts": { "command": "npx", "args": ["revenuecat-charts-mcp"], "env": { "REVENUECAT_API_KEY": "sk_your_secret_key", "REVENUECAT_PROJECT_ID": "proj1ab2c3d4" } } }
// Set DEMO_MODE=true for mock data { "revenuecat-charts": { "command": "npx", "args": ["revenuecat-charts-mcp"], "env": { "DEMO_MODE": "true" } } }
💬 "What's our MRR this month vs last month?"
💬 "Show churn by country for the past quarter"
💬 "How many new trials did we start this week?"
💬 "Compare revenue across iOS, Android, and Web"